

ProfitPoint Tour
- 1
- 2
- 3
- 4
- 5
- 6
 |
Interactive Report Design
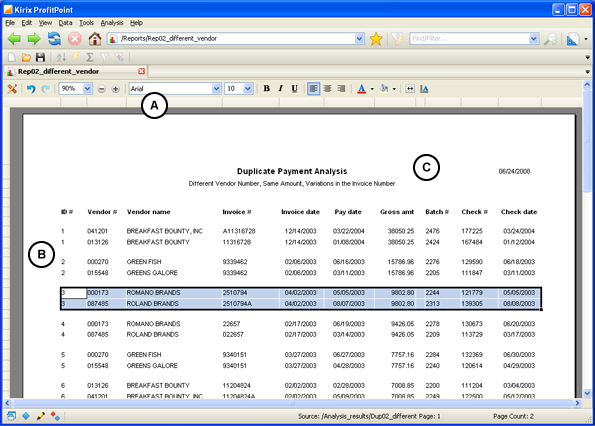
With Kirix ProfitPoint™, you can design reports quickly and easily by inserting and manipulating report components directly in a design view and then quickly toggle to a print view, allowing you to create printed reports that match the design you interactively create in ProfitPoint.
To define a report, drag fields from the column list into the design view, then in the layout view, select, insert, move and resize columns directly (A), "stack" rows of data to display specific rows on multiple lines, group data (B) to factor out common information into a group header or sort the data to see the information in a different order.
Using text entry components (C), you can create page headers and footers to title the report as well as show report statistics, such as current page, total number of pages and the current data source. When you are finished you can print the report or just as easily save it as a PDF to share with a co-worker.