Using the Table View
|
Using the Table View |
|
|
Accessing and Saving Data > Viewing Data Sets > Using the Table View
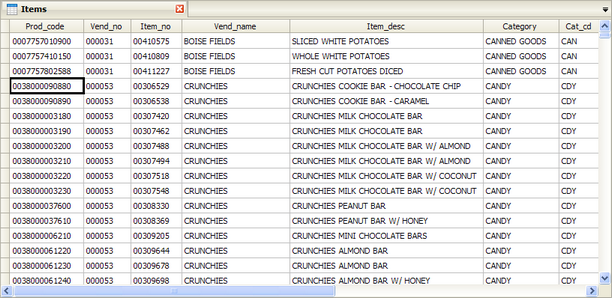
The Table view of a data set is the a classic grid that displays your records in rows and your fields in columns. This is also the main view for performing your standard data operations, queries, relationships, etc.
Overview of the Datasheet
The standard view of a data set in Strata is a table. A table is made up of fields (columns) and records (rows) and displayed in a grid format. Columns can be hidden and moved, rows can be resized and a wide variety of data operations are available via the toolbar icons and menu items. Additionally, many data operations are available by right-clicking the field headers (for data operations on entire fields like sorting or creating calculated fields) or individual cells (for context-sensitive data operations such as filtering or copying).
If tables are open, they can be closed by clicking the "x" or middle-clicking on the tab. You can toggle between tables simply by clicking on the different tabs. To see multiple tabs at once, just drag a tab to an edge of the screen until a blue box appears -- to the right or left if you want to tile your view vertically or to the top or bottom if you wish to tile your view horizontally -- and then release the mouse.
Working with Columns
Strata provides a flexible interface so that you can control your workspace efficiently. Columns are one such area in the datasheet:
NOTE: Insert Column enables you to insert and existing field into the table view. In order to add a new field to the table, you must use the Insert Field option in the Design View. Similarly, to delete a field entirely (not just hide it), you may also do this in the Design View.
Editing and Saving your Column View
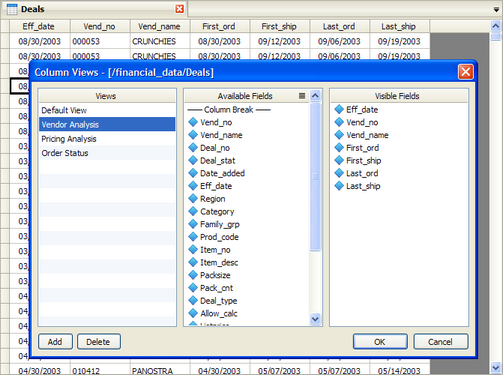
When you open a table the first time, the columns will appear in the same order as they appeared in the original data set. And, when you move or hide columns or create calculated fields, the fields will remain in that order the next time you open the table. However, sometimes it is useful to be able to save a specific column view while performing your analysis. Maybe for one task, there are only 3 relevant fields while, for another task, there may be 10 different required fields. To save these different column views, open the Data menu and select the Columns item. When this expands to show a sub-menu, select Edit Column Views and the following dialog will appear:
To add a new view, click on the Add button. To rename the view, double click on New View and edit the name. To create your new view, simply drag field names from the Available Fields column to the Visible Fields column. When you are finished creating your view, click the OK button.
To access your custom views, right-click on any field header and a menu will appear. Select Column Views from the menu and a sub-menu will open showing all of the column views you've created. Select one of these saved views to change the way your table is formatted. You can always go back to the default view by selecting the Default option.
Formatting your Table
By default, the Format toolbar is embedded at the top of each report document you open. This makes it very easy to access the formatting tools and doesn't take up additional space when you are using other types of documents (tables, queries, etc.)
However, sometimes it is useful to be able to access the Format toolbar for other document types, particularly for tables. To toggle the Format Toolbar from being embedded in the report to being available for all documents, simply go to the View menu and select Format Toolbar. The Toolbar will then appear underneath the Bookmarks Toolbar and be available at all times. You can perform the following formatting on your table view:
Protecting and Locking Data
Strata lets you edit the data within the individual cells of the datasheet. This can be very useful when working with data. However, if you are not specifically editing your data, it is best to protect your data from inadvertent editing, which can result in loss of data.
To protect your data, select Protect Data from the Edit menu. If there is a checkmark next to the menu item, it means that your data is protected and the software is set to a read-only status. When Protect Data is on, you will disable your ability to modify the values within a datasheet, including such tasks as:
If you wish to perform these operations, simply uncheck the Protect Data menu item.
NOTE: If the datasheet is locked and you attempt to perform an operation that would modify the datasheet, the software will display a warning box asking if you wish to proceed. If you choose to proceed, the data lock will be deactivated for that operation. The datasheet will remain locked after that operation has been performed until you manually unlock the data sheet as discussed above.
Setting Datasheet Preferences
Strata enables you to customize the colors, font and formatting of your datasheet. To change these settings, select Options from the Tools menu and then select the Datasheet tab. The preview on the bottom of this page will automatically update depending on your choices. Select the Apply button to apply these settings to your workspace.
Using Tabs
To open up a new blank table, click on New > Table from the File menu. Alternatively, you can select New > Table from the New icon on the Bookmarks Toolbar. You can then enter data into the table.
Additionally, to tile tabs vertically or horizontally, you can select Tabs > Horizontal Group or Tabs > Vertical Group from the View menu.
|