 During our journey from the MySQL Conference last week to the Web 2.0 Expo this week, we've continued to see a common pattern. There are a tremendous number of back-end business systems and almost all of them seem to rely on the humble Web browser for the front-end.
Now there is a very good reason for this — the Web is a tremendous distribution platform and companies are taking advantage of the same protocols and tools on their intranet that have already propelled the growth of the Internet. And, bottom line, browsers are really, really easy to use.
Data Integration 2.0
As an example of this situation, we met some folks last week from Snaplogic. Their product makes it really simple to integrate data from back-end systems and enables you to access data from anywhere, mash it up and publish it. However, when they were demoing the software, there wasn't particularly much to show off, since a normal browser can't do much with the data except let you “Save As” to your desktop.
Thankfully, this type of front-end work is perfectly suited for a data browser. So, we decided to demo each other's products at the Web 2.0 Expo this week. Snaplogic is able to easily show the value they bring to the table by actually displaying the data integration they can do. We put together a quick dashboard with Snaplogic data and were able to show off all the cool stuff you can do once you've got a data feed to work with. Indeed, this was like the serendipitous combination of chocolate and peanut butter.
The Last Mile
This reminded me of a great metaphor used in a post by Juice Analytics called “The Last Mile of Business Intelligence.” The idea is that businesses have built lots of large back end systems — from data integration and warehousing to BI and reporting systems. But, in the end, it still seems that actual users are left out in the cold. The “last mile” between the heavy machinery and the actual knowledge worker has not been adequately bridged.
So unfortunately, the typical pattern involves working with a back end system via a Web browser and then, ultimately, exporting a CSV file to work with in Excel.
This is not terribly efficient. A data browser enables you to open up those same intranet pages and perform your normal browsing tasks. However, because it's a data analysis tool at heart, you can actually open up data sets and start working with them directly. Then you can do fun things like bookmark tables, build calculations, create reports and write queries and have it refresh the next day with the latest data. Because of this, it plays very nicely in the worlds of of exploration and reporting per Juice's “data value framework.”
Why Incorporate the Web?
In the past we've shown off some of the fun things Kirix Strata™ does — like open up HTML tables natively or showing RSS feeds in a table view — but often we'll get a response like, “that's cool, but what do I do with it?” There is no question that tools like these can be very useful for some tasks (e.g., integrating data from the web with local tables), but they're really just icing on the cake.
The important thing is how tightly the web is integrated with the data analysis tool. This opens up all kinds of possibilities for direct interaction with both the Web infrastructure and the database systems that power business intelligence in the enterprise. Add some Web APIs into the mix, and now you could have access to the contact information in your ACT database, the corporate newsletter contacts in a MySQL system and all the recent sales information from your Salesforce.com account. Explore and integrate at will.
Given that the meme “Enterprise 2.0″ resounds louder each day, we should only expect to see Web infrastructure reaching deeper and deeper into organizations. In the end, maybe part of the BI “last mile” solution is just giving businesses a browser with a bit more intelligence.


 I recently saw this announcement for an open source tool and thought it might be interesting to some folks that deal with messy data sets.
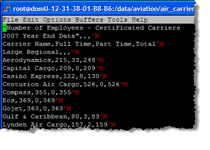
 Ah, tax season… could there be a more thrilling time of the year?
 Today I came across a
  I just read a pretty interesting article by Neil Raden called “
 If you haven't checked out what the fine folks at