 (NOTE: Screencast of this exercise is available below.)
A few days ago, the always datariffic folks at Juice Analytics posted an article about MacGyver-ing call volume data and pushing it into an online mapping application called Mapeteria. Basically, they were doing some ad hoc data visualization comprised of public web data, private phone call data and a web service that provided the visualization (which in turn used the Google Maps API).
Huh… local data, web data and web APIs? Sounds like a perfect application for a data browser (well, it would've been perfect if the web service accepted a POST command, but I digress). A data browser enables you to easily access web data, combine it with local data, perform any required data clean up and then push/pull data from the web — without ever leaving the tool.
It also would've saved Juice a bit of time, particularly with grabbing area codes and prepping that file. Let's look at the four steps they went through and we'll see how Kirix Strata™ might improve the experience:
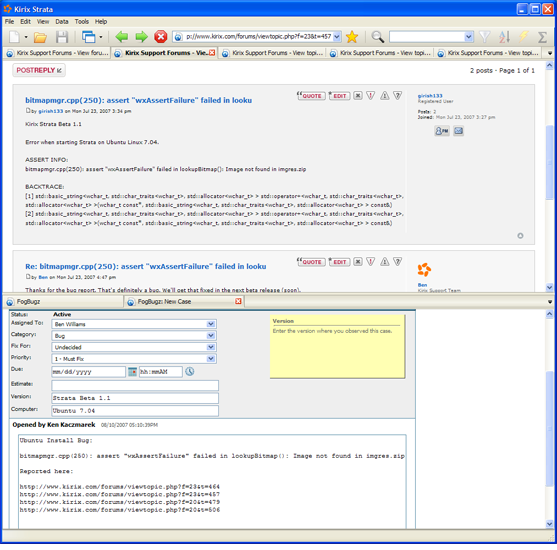
1. Pull out the area codes.
The data had phone number values like “12345678901″ as well as “2345678901″, so they used the following formula to pull out the area codes using Excel:
=VALUE(IF(LEFT(E7,1)="1",MID(E7,2,3),MID(E7,1,3)))
Strata would use a similar formula:
iif(left(tel,1)="1",substr(tel,2,3),substr(tel,1,3))
The main time savings here (particularly with large files) is that the calculated field populates automatically for every record in Strata, instead of needing to paste formulas. OK… not terribly exciting thus far.
2. Convert area codes into states
This is a multi-part step:
a) Locate a table from the web that has area code data associated with a state ID (while fending off parasitic scammers).
b) Clean up the table as necessary.
c) Do a lookup from the phone call data that adds in the state where the call originated from.
Strata can really cut down the amount of time spent on this step. Because of the website used, the folks at Juice surely had to create his lookup table manually. I went to Delicious, searched for “area codes” and found this very useful website, which had all the data in a nice HTML table. With Strata, I simply right-clicked and selected “Import Data” and immediately had the table I needed for the lookup.
Finally, I created a relationship between my two tables and dragged in the state codes (e.g., CA, IL, NY, etc.) into the phone call data.
3. Create a summary data set
This was done using a pivot table in Excel. Strata doesn't have classic pivot tables in its feature set at this point, but it does have a nice li'l grouping utility. So, once I knew what csv format was required for the Mapeteria web service, I grouped the data accordingly.
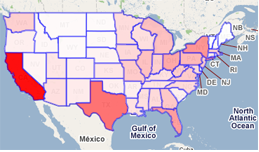
4. Create colorized map the of U.S.
This is the “almost perfect” part I referred to above.
Though Mapeteria is a very cool visualization service using Google Maps, it needs to fetch a CSV file embedded in a URL from elsewhere on the web. If the service was able to accept data via a POST command (or something like an “Upload Data” button), Strata would have been able to just take the table we created and push it to the web service, no csv transformation required (in fact, we've got some stuff cooking in our labs that would make this as easy as copy and paste). And, if we were just able to push the data out like this, we would have immediately gotten the map without ever leaving our data browser.
But, like Zach at Juice, I had to save the file in a CSV format and then upload it to a server before I was able to get my map. Here's a screencast of the entire process… once I found the area code data on the web, it took less than 5 minutes to get my map.

(And here's an embeddable YouTube version…)
If anyone wants to try this process out for themselves, please feel free to download Strata and give it a try. This data browser is in beta and completely free to use; we're also giving away free full licenses to anyone who provides feedback during the beta period. Oh, and here is the sample phone call volume data I used for this exercise:
Click here to download Phone Call Volume Sample Data (.csv, 10KB)
This is a pretty simple example of how Strata can be used for ad hoc data access and manipulation with data from the web (or, as one can imagine, within a corporate intranet) and make this kind of analysis very efficient. Throw in some web services, web APIs or very large files into the mix, and you've got the chance to do some fairly interesting things.
As always, if anyone has any questions, either post in the comments below on in our support forums… or just shoot us a support email. Thanks!


 We haven't been doing much regular blogging lately, but we're hoping this will change in the coming weeks.
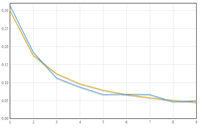 Benford's law is one of those things your high school math teacher would break out on a slow, rainy day when the students' attention span was even lower than usual.