

Fun (and Fraud Detection) with Benford's Law
 Benford's law is one of those things your high school math teacher would break out on a slow, rainy day when the students' attention span was even lower than usual.
He'd start out by asking the class to look at the leading digits in a list of numbers and then predict how many times each leading digit would appear first in the list. The students would make some guesses and eventually come to the consensus that the probability would be pretty close — about 11% each.
Then, the teacher would just sit back, smile, and gently shake his head at his simple-minded pupils. He would then go on to explain Benford's law, which would blow everyone's mind — at least through lunchtime.
(Click the image above… or here's an embeddable YouTube version)
Per Wikipedia:
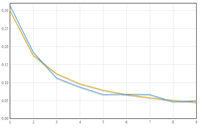
Benford's law, also called the first-digit law, states that in lists of numbers from many real-life sources of data, the leading digit is distributed in a specific, non-uniform way.
Specifically, in this way:
Leading Digit     Probability
      1              30.1%
      2              17.6%
      3              12.5%
      4               9.7%
      5               7.9%
      6               6.7%
      7               5.8%
      8               5.1%
      9               4.6%
Again, from Wikipedia:
This counter-intuitive result applies to a wide variety of figures, including electricity bills, street addresses, stock prices, population numbers, death rates, lengths of rivers, physical and mathematical constants, and processes described by power laws (which are very common in nature).
Boiling it down, this means that for almost any naturally-occurring data set, the number 1 will appear first about 30% of the time. And, by naturally occuring, this can mean check amounts or stock prices or website statistics. Non-naturally occurring data would be pre-assigned numbers like postal codes or UPC numbers.
Besides being fun to play with, Benford's is used in the accounting profession to detect fraud. Because data like tax returns and check registers follow Benford's, auditors can use it as a high-level check of a data set. If there are anomalies, it may be worth investigating closer as potential fraud.
If you're interested in further information about fraud detection using Benford's, definitely give these two articles by Malcolm W. Browne and Mark J. Nigrini a read.
Try It Out for Yourself
Take a look at the demonstration video above to see Benford's law in action with data sets from the web. If you'd like to play with it yourself, just install the Benford's Law extension for Kirix Strata™ and have fun.
Also, please note that I used the following data sets in the video, if you'd like to give those a spin:
Wikipedia List of Lakes in Minnesota
US Census Data Sets
Social Blade - Digg Statistics
And here are a few other worthy ones that didn't make it in the video:
NASDAQ Historical Stock Price
Wikipedia List of Countries by Population
And plenty more at Delicious here…
Enjoy!
July 24th, 2008 at 10:45 pm
This interested me so I wondered whether or not this would work with random numbers. I decided to test this with the Random class in java and I calculated the percentages. I tried it with just the numbers 1-9 and then with three digit numbers 100-999 and both came to be about 11% for each leading digit. I guess that's because of the way the Random class generates the numbers and it was an unexpected result that I thought was kind of interesting.
July 24th, 2008 at 11:34 pm
Hi Geoff,
Yeah, I agree, it's really interesting. When I was prepping for the video, I actually did the same thing, but because the video was getting a little long, I had to cut it. If you've downloaded Strata, you can try this out pretty quickly:
1. Open up a data set, then right-click on the field name and select “Insert calculated field”.
2. type in rand(), which will populate your calculated field with random numbers; you can play with the number of digits by doing something like rand() * 100; then hit OK.
3. Run your Benfords test. (one note, the rand() function is dynamic, so the values change each time you do something with the field, so you can keep hitting “Graph” and you'll get new random graphs each time. To set this as static, you'd right-click on the field header and select “Convert to fixed fields”).
Overall, it is pretty amazing what Benford's does apply to — stock market data for instance. Another thing I cut from the video was taking 200 random stock quotes and running benfords on price and volume… amazingly, worked like a charm. Not only that, you can multiply the stock price by currency conversions (say Yen or Euro) and Benford's still holds.
Thanks for the comment!
July 25th, 2008 at 1:19 am
you should be glad your Random class generates with 11% distribution. otherwise it's broken
July 25th, 2008 at 2:25 am
Haha yeah… I was kind of thinking that anything but 11% would mean it's broken but was still curious. I also modified my program to do 1-9999 instead of just checking numbers with the same amount of digits and still 11%. It does make sense that it should be 11% but I still had to try.
Ken, I'm going to have to download Strata and play around with it although I do wish there was a OSX version. I'll just have to install it on my VM, it looks like a very fun program!
July 25th, 2008 at 3:37 am
Wow. Just amazing.
I love that the founder of Digg has a 97% chance of having his choices land on the front page.
July 25th, 2008 at 3:39 am
The whole point is that the numbers that this Law is referring to are not truly random, which means that they're predictable (every statistician's favorite quality). This is simple probability. It's basically gambling, if you were going all in every round. Let's say you have a 20% chance of winning any hand. You have a 20% chance of simply winning the first hand, but since you're all in, winning the second hand is predicated on you winning the first, therefore your chance of winning the second hand is only 4%. The result will fit a logarithmic curve, as in Benford's Law. In any situation where there is are multiple data points, all of them moving away from zero, and there is a constant probability of further movement less than one, the resulting distribution will be logarithmic. And forgive me if that sleep-induced, hurried definition is lacking; I'm a PoliSci major, not a mathematician.
July 25th, 2008 at 5:20 am
Can Benford's Law be used in detecting fraud within an evaluation survey? For example: 1 through 5 where 1 represents the best and five the worse. Suppose someone alters the scores after the evaluation is given. Thanks.
July 25th, 2008 at 5:44 am
This law doesn't apply to all numbers. You have to be selective. It only applies to quantities that change a little over time.
This is why it can be used on stock prices and tax returns: it is extremely unlikely that either jump n-fold; most of the time they change by small percentages.
This is better illustrated with an example. Say a product starts costing $1000. With inflation at, say, 3%, over time the price increases to $1030 after the first year, then $1060.9 ($1000*1.03*1.03), then $1092,727 ($1000*1.03*1.03*1.03) and so on. As you can see, the leading number is always 1. If you wait even longer, eventually the price will reach $2000. So 1 is not the leading digit any more. But now the price will stay in the $2000-2999.99 bracket for a shorter period of time because if even inflation were to stay at 3%, 3% over $2000 makes that price increase by increments of $60, not $30 as when the price started at $1000.
If you extend this argument you will see that as the price increases, it will stay for shorter periods of time in the same bracket.
Well, eventually that price will reach $10000. At this point the price will stay in the $10000-$20000 bracket for quite a while longer than when it was in the $1000-$2000.
Get it? It's beautiful!
July 25th, 2008 at 7:39 am
A long time ago I read that the proportion of digits (1 to 9) from a book of log tables would match the proportions of those digits on a slide rule.
Is this the same law?
July 25th, 2008 at 8:32 am
@ Geoff — re: Mac version, it is on the feature list for sure (we get this feature request more than any other). Send us a quick email to support -at- kirix -dot-com and we'll contact you when the beta is available.
@Eloy — as Nuno described with his very nice example, it would not apply to your survey. One of the other things to note about Benford's is that doesn't work with data sets limited to certain categories, even if that original set followed Benford. For instance, if the data is filtered to see “only ages 30 to 40″ or “all lakes less than 50 feet deep, Bendford will not apply.
@moronmark — I'm not sure whether it is the same, but it sounds good. However, interesting to note the legend surrounding the discovery of this law. Benford had noticed that the first pages of a logarithm book he was using were more worn than the latter pages. Based on this observation, he began to investigate why this was the case, which led him to his discovery (historical note: some claim Benford first observed this, others claim that an astronomer Simon Newcomb first observed it).
July 25th, 2008 at 8:57 am
Is there a proof of this law? I would love to read it.
July 25th, 2008 at 9:10 am
Hi Weaver, these may be helpful to you:
http://www.mathpages.com/home/kmath302/kmath302.htm
http://mathworld.wolfram.com/BenfordsLaw.html
http://plus.maths.org/issue9/features/benford/
July 25th, 2008 at 10:29 am
I just ran several “naturally occuring” datasets, and I found that about half of the curves resembled the Benford's curve with some imagination. Some were total opposites. It appears to be random. Sorry, I was excited about it too!By the way, the check writing story is not naturally occuring data either, my phone bill usually starts with 8, does that mean verison calculated it wrong?
July 25th, 2008 at 11:23 am
Hi Dean,
It can only mean one thing: FRAUD! Just kidding… it's hard to say without looking at the data. Are you using data from the web and, if so, can you post some links? A few other related notes:
1. Your phone bill may just need to have a much larger sample (say, all phone bills that the phone company gives out). The sample size of an individual phone bill probably won't be enough to prove anything one way or another. As mentioned above, this might fall into a “category” of a larger sample (”my phone bill only”), whereas if you took the full set, it would show a Benford's distribution.
2. As for checks, in the example, I only used the checks that I got from the case (listed in one of the articles I linked to), not the entire data set. And auditor would basically use Benford's as a thumbnail estimate to see whether or not something is worth investigating further. He may run benford's on the entire set and see that there are blips in 8s and 9s and then dig down into the data to pinpoint the issue. Benford's is definitely used in this area; we've run into it in the accounts payable industry on numerous occasions. However, I'm not fully knowledgeable as to the exact steps the auditors use when applying Benford's. At some point you need to have a decent set of data or else it is going to be skewed.
3. If you've got a naturally occurring data set that should follow Benford's but doesn't, it may not be fraud but something else. For example, if an employee can submit expenses up to $25 without authorization but needs manager approval for anything $25 and above, Benford's (particularly 2-digit resolution) may show you a huge spike in the number 24… this likely has less to do with fraud and more to do with people just not wanting to bother to get approval.
Anyway, if you have more info on the data sets you are looking at, lemme know and I'll be happy to take a look at ‘em.
July 26th, 2008 at 11:40 am
nice analysis, thanks for sharing.
July 27th, 2008 at 3:54 pm
Phone bills probably not follow Benford's Law, unless you take them from a properly sampled set in numerous currencies. In the United States, a basic phone bill is typically $25 per month per line, plus taxes and long distance. Most people aren't going to spend enough long distance to push it over $100, so there will be no bills between $10 and $19.99, and very few over $100, so there will be few that start with 1. Other countries will have similar biases, but not at the same number. For example, however many Euros typical French phone bill comes to, the price will have a floor that applies everywhere. So if you took every phone bill in the world, without converting the local currency, you probably would get a Benford distribution.
I doubt that individual stock prices will follow the “law”, either, because companies usually want their stock price to be about $30 to $60, and will use splits or reverse splits to keep it there, so again it's not naturally occurring.
Things like baseball batting averages are also going to be selected away. It's impossible to hit 1.000, and anyone hitting under 0.200 will get sent to the minors, so there a lot of 2s, a few 3s, and the very rare 4 and no more. On the other hand, number of hits will have a lot of 1s. Anyone not getting 100 hits in a season won't be around long, and few players get more than 200.
I can't figure out all the conditions that make it work, but it certainly will if it grows exponentially, as discussed by Nuno Lagoa, or when it's something that becomes progressively rarer but the distribution covers at least a full order of magnitude, like lake depth. I bet the number of bytes in each file in a random collection would work, too.
July 27th, 2008 at 7:40 pm
[…] has a video illustrating Benford's Law against Digg post submissions. They also use the law to show how a woman in Arizona was making fake payments to a fictional […]
July 27th, 2008 at 10:09 pm
I didn't bother watching the movie, but we did an experiment like this in a statistics class in college. Everybody looked at a random address in the phone book and we wrote down the first number. Plotted it, and sure enough we got this curve.
July 28th, 2008 at 2:41 am
RE: Telephone bills and sports statistics: I agree with the folks who said that these would not be regular “natural” statistics, but I bet you could easily get them to follow the same sort of formula. For phone bills, for example, take that theoretical minimum of around $25 per month and subtract it from each phone bill value. You should then have a range extending from zero to some upper limit, and that range would probably follow a Benford curve. Similarly, if you were to take all of the batting averages and subtract .200 from them, you would wind up with a set of values from zero to probably around .150 or so, with a few odd points out there. Actually, now that I think about it, I would probably try that one by finding the “average average,” so to speak, and plotting the difference from that mean point. I'd be willing to bet, although I might not wager that much, that the plot of deviation from the mean batting average would probably follow a Benford curve, too. Anyway, just thinking rambling thoughts at 2:30 in the morning. Feel free to disregard…
July 28th, 2008 at 5:02 am
[…] Fun (and Fraud Detection) with Benford's Law | Data and the Web […]
July 30th, 2008 at 2:39 pm
But why does this happen?
July 30th, 2008 at 3:19 pm
Here's a pretty good “practical” explanation from http://www.rexswain.com/benford.html using stock prices as an example:
====
Dow Illustrates Benford's Law
To illustrate Benford's Law, Dr. Mark J. Nigrini offered this example:
“If we think of the Dow Jones stock average as 1,000, our first digit would be 1.
“To get to a Dow Jones average with a first digit of 2, the average must increase to 2,000, and getting from 1,000 to 2,000 is a 100 percent increase.
“Let's say that the Dow goes up at a rate of about 20 percent a year. That means that it would take five years to get from 1 to 2 as a first digit.
“But suppose we start with a first digit 5. It only requires a 20 percent increase to get from 5,000 to 6,000, and that is achieved in one year.
“When the Dow reaches 9,000, it takes only an 11 percent increase and just seven months to reach the 10,000 mark, which starts with the number 1. At that point you start over with the first digit a 1, once again. Once again, you must double the number — 10,000 — to 20,000 before reaching 2 as the first digit.
“As you can see, the number 1 predominates at every step of the progression, as it does in logarithmic sequences.”
====
For the actual mathematics, here are a couple links you can investigate:
http://www.mathpages.com/home/kmath302/kmath302.htm
http://mathworld.wolfram.com/BenfordsLaw.html
August 7th, 2008 at 12:12 pm
This explains why I can't seen to break 100 playing golf !
August 7th, 2008 at 12:49 pm
Damn, dude! Get a life…
January 22nd, 2009 at 8:58 am
In the next link is Mark Nigrini explaining the Benford's Law and most interesting is his comentary about de data related on Enron and how can Benford's Law would advise from that fraud.
http://fraudit.blogspot.com/2009/01/nigrini-y-ley-de-benford.html
But, be carefully because in statistics there are the Errors Type I and Type II, an explanation and implications about these and Benford's Law in the next link
http://fraudit.blogspot.com/2009/01/nigrini-y-ley-de-benford.html
February 3rd, 2009 at 3:59 pm
How can I use this to play lotto?
February 3rd, 2009 at 4:07 pm
As far as lotto… bottom line, you're out of luck. The lottery is based on random numbers (number 10 has the same chance of appearing as the number 50). Benford works on “naturally occurring”/logarithmic amounts.
February 19th, 2009 at 3:13 pm
[…] The Benford's Law and Fraud Detection Analysis enables you to graph a data set against a Benford's law curve to find abnormalities within the data. This enables you to quickly ascertain the accuracy of the data, which is particularly helpful for detecting fraud in various business data such as check payment amounts. See a video of this extension here. […]
March 17th, 2009 at 4:20 am
But if we switch from decimal to binary numbers, every binary digit will start with 1! Thus, the first figure is 1 in 100% cases!
April 30th, 2009 at 1:51 pm
Wow! I am an auditor and we use “judgemental sampling” in my department … in other words we look at a set of records(disbursement checks, for example) and pick “x” number of them to test. Usually, that leads to samples based on interesting vendors or something like that. I decided to look into a better way to pick samples, so I tried using Banford's Law. Amazing! Out of a sample set of about 14,000, 5, 7, and 9 were off. The rest were within 5% of the predicted value. So, I used some other statistical analysis on the 5, 7, and 9 data sets and have, thusfar, uncovered six fraudulent schemes. I love numbers!
April 30th, 2009 at 2:21 pm
Eric, that's great! Thanks for sharing. By the way — we've got a couple other internal auditor extensions that we've been wanting to build (statistical sampling, stratification, etc.), so shoot us a support email (support@kirix.com) if you'd be interested in knowing when those get released for Strata too.
December 6th, 2009 at 4:59 pm
This isn't actually just interresting; this is fasinating! I did the same as the 1st poster before i even read the reply, but with another random generator which generated ‘random' numbers from one to a milion. At first it was close to the benford's law, but after like 500thousand it became more off. End result was this:
1: 241098 = 24.11%
2: 183346 = 18.33%
3: 145647 = 14.56%
4: 117081 = 11.71%
5: 94570 = 9.46%
6: 77008 = 7.70%
7: 60312 = 6.03%
8: 46829 = 4.68%
9: 34097 = 3.41%
(the first number is how often it was chosen out of a milion times)
Anyway, thanks for making the video. I've enjoyed it
December 8th, 2009 at 9:32 pm
[…] cool part is, forensic investigators use it when the think some one is cooking the books! Check out this cool video on it and actual data sets. It's kind of freaky […]
March 8th, 2010 at 7:25 pm
[…] Leading Digit Probability 1 30.1% 2 17.6% 3 12.5% 4 9.7% 5 7.9% 6 6.7% 7 5.8% 8 5.1% 9 4.6% Now let's see in more details how this works. The following video is taken from the website called Kirix. […]
May 13th, 2010 at 11:34 am
This actually makes perfect sense, and none of you should be surprised. The people that are assuming 1-9 are the original digits and using rand() are thinking about it the wrong way. In naturually occuring data sets, there is no 1-10 limit. It's orders of magnitude… Lets do 9 sets… the first one just contains 1, chance is 100% it's a 1, second set contains 2, chance is 50% it's a one. Third set is a 3, chance is 33% it's a 3. When you add these % up through nine, then divide by nine, guess what you get… 31.4%… and this is a very course discretization
June 21st, 2010 at 7:09 am
There are also quite a number of good articles on the subject at Dr. Mark Nigirinis site nigrini dot com. He is an accounting professor who wrote his PhD thesis on Benford's law.
September 1st, 2010 at 10:35 am
It is seriously cool as it is completely scale invariant. measure it in whatever unit it will always match, though why should nature change its rules depending on how we measure it?
September 8th, 2010 at 10:27 am
[…] do not follow Benford's law. For more information you may want to read other accounts of Benford's law on the […]
October 2nd, 2010 at 5:04 am
[…] when humans do this they often leave tell-tale signs that indicate the data were tampered with. See Benford's Law for one example. I know, I know, perhaps only the stupid scientists wouldn't be able to […]
December 5th, 2010 at 11:04 pm
Perhaps I dont understand this aspect of the opener video fully, but aren't the amounts payed to a vendor pre-assigned in every case? Wouldn't they not follow Benford's Law because they instead correlate to a fixed amount of goods/services that this company would be supposedly providing?
December 6th, 2010 at 8:23 pm
@Chris — a vendor number (e.g., 0341993) would be pre-assigned, but any invoice price can vary from one to the next (10 widget A @ $15; 4 widget B @ $22, etc.). The “random” nature of the total price would tend to follow benford.
December 8th, 2010 at 4:59 pm
I've just learned about Benford's law and have decided to apply it to the data from a potentially fraudulent scientific paper. But it's kind of hard to learn all the in's and out's. I decided to use only numbers that are part of the statistical analysis, such values for correlation coefficients, t-tests, and so on. But I excluded things that I wouldn't expect to be fudged, like sample size (and of course not dates and not numbers cited from other people's work). I would like to know what others think about the applicability of Benford's Law in this case. I'm still extracting numbers (by hand, because I have to be able to judge what is a statistic and what isn't). The distribution so far with n = 155 is as follows:
1 16.1%
2 29.0%
3 9.0%
4 17.4%
5 12.3%
6 7.1%
7 5.2%
8 1.9%
9 1.9%
Not at all what Benford's law predicts, but there are so many unanswered questions: What is an adequate sample size? Does the fact that some numbers keep recurring in the data mean that I should edit it? For example the power test always comes out around d = 2.xx and the hit rates for different conditions are all in the range of 50-60%. How can I learn a lot more about the forensic use of Bedford's Law, i.e. all the relevant considerations? I've been reading tons so far but nothing to answer the above.
ron
December 19th, 2010 at 12:37 am
Does anyone here recognize the correlation of this principle and the golden ratio?
*Gather data sets into separate bins
*Analyze mean data of all bins into one “0-9″ data points.
*Total of all Figures = total ‘area' of perfect rectangle.
*Divide total by each number; highest to lowest.
The result should be a close representation of the ratios of areas of golden triangles descending order.
Maybe a derivative of the Fibonacci sequence the same way Pareto's Law is, but interesting just the same.
June 2nd, 2011 at 6:55 am
I wonder how this applies to white noise static? How about to breaking numeric codes? At one point we had an algorithm that required a random number set to simulate background noise so we took random numbers from a calculator to provide the data. Based on Benford's Law, I wonder if the resulting algorithm was accurate or not…
March 15th, 2012 at 12:44 am
That is some crazy math. Never even heard of Benford's law before.
September 3rd, 2012 at 8:47 pm
Earlier this year I published a book on the topic (”Benford's Law: Applications for forensic accounting, auditing, and fraud detection, Wiley, 2012). The first few chapters review the maths (the effect of multiplying the numbers by a constant, changing the base, and so on). In the book there are many applications including the census numbers, election results, stream flow numbers, and tax return numbers. The companion site http://www.nigrini.com/benfordslaw.htm has free Excel tempates, data sets, photos, and other interesting items. Enjoy.