

ProfitPoint Tour
- 1
- 2
- 3
- 4
- 5
- 6
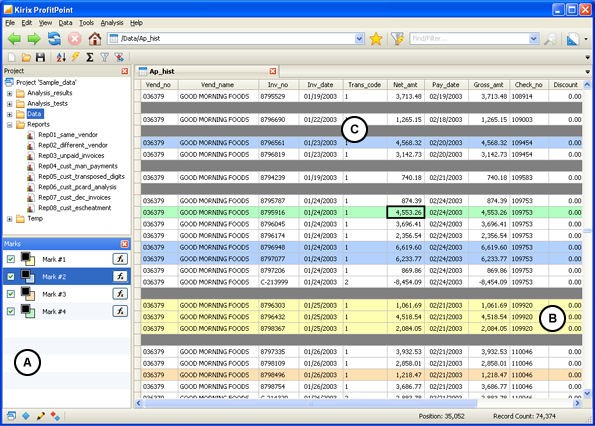 |
Visual Analytical Capabilities
Using Kirix ProfitPoint's analytic functionality, you can quickly get answers to important questions about your data.
Using marks you define (A), you can immediately mark records (B) matching the criteria you specify. Once you've defined these marks, you can toggle them on or off or change their color to highlight different records at different time in different ways, or you can modify the formula directly and see corresponding changes in the matching records.
In addition to marks, you can visually break the data up into groups (C), inserting a blank line every time an important value, like check number, changes, allowing you to visually see related groups of information directly on the screen.