2008 July | Data and the Web

Data and the Web

Archive for July, 2008

Kirix Strata 4.1.1 Maintenance Release

Thursday, July 31st, 2008

Image - Strata IconJust a quick note that we released a minor update to Strata today, which includes some bug fixes but mostly added some important bits and bobs to our scripting API. Besides a bunch of scripting fixes, we added a timer class and asynchronous events to HttpRequest and FileTransfer classes. You'll see these in action soon for some of the extensions we have in our own queue. Or, feel free to try them out yourself.

In addition, please note that if you are using the Benford's Analysis extension we mentioned in the previous post, it too has been upgraded to deal with a pesky field naming bug. It is backwards compatible with 4.1, but the old extension will not work with 4.1.1. You can install the upgraded extension from here.

Fun (and Fraud Detection) with Benford's Law

Tuesday, July 22nd, 2008

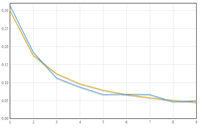
Benford Law Graph - smallBenford's law is one of those things your high school math teacher would break out on a slow, rainy day when the students' attention span was even lower than usual.

He'd start out by asking the class to look at the leading digits in a list of numbers and then predict how many times each leading digit would appear first in the list. The students would make some guesses and eventually come to the consensus that the probability would be pretty close — about 11% each.

Then, the teacher would just sit back, smile, and gently shake his head at his simple-minded pupils. He would then go on to explain Benford's law, which would blow everyone's mind — at least through lunchtime.
Play Benford's Law Video

(Click the image above… or here's an embeddable YouTube version)

Per Wikipedia:

Benford's law, also called the first-digit law, states that in lists of numbers from many real-life sources of data, the leading digit is distributed in a specific, non-uniform way.

Specifically, in this way:

Leading Digit     Probability
      1              30.1%
      2              17.6%
      3              12.5%
      4               9.7%
      5               7.9%
      6               6.7%
      7               5.8%
      8               5.1%
      9               4.6%

Again, from Wikipedia:

This counter-intuitive result applies to a wide variety of figures, including electricity bills, street addresses, stock prices, population numbers, death rates, lengths of rivers, physical and mathematical constants, and processes described by power laws (which are very common in nature).

Boiling it down, this means that for almost any naturally-occurring data set, the number 1 will appear first about 30% of the time. And, by naturally occuring, this can mean check amounts or stock prices or website statistics. Non-naturally occurring data would be pre-assigned numbers like postal codes or UPC numbers.

Besides being fun to play with, Benford's is used in the accounting profession to detect fraud. Because data like tax returns and check registers follow Benford's, auditors can use it as a high-level check of a data set. If there are anomalies, it may be worth investigating closer as potential fraud.

If you're interested in further information about fraud detection using Benford's, definitely give these two articles by Malcolm W. Browne and Mark J. Nigrini a read.

Try It Out for Yourself

Take a look at the demonstration video above to see Benford's law in action with data sets from the web. If you'd like to play with it yourself, just install the Benford's Law extension for Kirix Strata™ and have fun.

Also, please note that I used the following data sets in the video, if you'd like to give those a spin:

Wikipedia List of Lakes in Minnesota
US Census Data Sets
Social Blade - Digg Statistics

And here are a few other worthy ones that didn't make it in the video:

NASDAQ Historical Stock Price
Wikipedia List of Countries by Population
And plenty more at Delicious here…

Enjoy!

Predict the Future with Some Ad Hoc Time-series Forecasting

Wednesday, July 16th, 2008

Lokad LogoWe're happy to announce that we've teamed up with the good folks from Lokad to create a Kirix Strata™ forecasting plug-in, which you can use with your own time-series data.

Lokad is a company that has created some slick forecasting software and, thankfully, offers it as a web service via their API (you can also upload data directly to their site). Here's a link where you can find lots of good information on their technology. Bottom line, they offer some great business forecasting tools at a cost-effective price. Their API was a piece of cake to work with and so we were able to quickly put a GUI on it and create the Strata Lokad forecasting extension.

Play Video

(And here's an embeddable YouTube version…)

Obviously, there's quite a bit of forecasting that goes on day to day within companies. When you veer toward the largest companies, you'll find departments dedicated to forecasting with automated processes built into their ERP systems. With smaller companies, forecasting is likely performed by someone without the word “forecast” in their job title. For instance, a warehouse manager may need to forecast inventory to make solid replenishment orders. Proper forecasting prevents the costly mistake of either overbuying (spoilage, locked-up cost of capital) or underbuying (lost sales).

However, the sweet spot for the Strata Lokad extension is ad hoc forecasting; it's for people who have various, changing data sets and need their forecasts on-the-fly. Business consultants who provide forecasts for their clients would fall in this category. In addition, this extension can benefit sales analysts who don't have adequate forecasting from their OLAP systems or financial analysts interested in different cash flow forecasts.

The great thing about forecasting algorithms is that they apply to a wide range of circumstances. So, if you've got some historical data to throw at a situation, you can get back some good results.

So, if you've got some time-series data and want to predict the future with it, give the Lokad forecasting extension a try. The installation itself along with all the details can be found here. If you've got questions about the plug-in, send ‘em our way. And, if you've got any questions about Lokad, their technology or forecasting in general, please feel free to give them a shout — they're quite knowledgeable and helpful.

P.S. We're pleased to note that this is the first extension we've made public that takes advantage of Strata's web scripting capabilities that brings a web API to the privacy and comfort of your own desktop. Got another web API you'd like to see work with Strata? Let us know.

Infochimps and Numbrary: More Data Than You Can Shake a Stick At

Thursday, July 10th, 2008

Infochimps and Numbrary LogosThese are some very good times for those of you out there who like publicdata. I ran across Kevin Chai's research website today that has a nice listing of various data sets, blog articles and other data-related goodies.

This reminded me of a couple other really interesting websites that are trying to solve the problem of data accessibility. Check ‘em out:

Infochimps.org

Infochimps wins the award for compiling massive data sets. If this is your thing, you may want to have a look. For instance, in a recent blog post, they provided a peek into some of the hidden gems of their collection, including:

  • Full game state for every play of every baseball game in 2007, majors and minors. Additionally, for about half of the major league games, pitch by pitch trajectory and game state information. (MLB Gameday)
  • Word frequencies in written text for ~800,000 word tokens (British National Corpus)
  • All the Wikipedia infoboxes, turned on their side and put into a table for each infobox type.
  • 250,000+ Materials Safety Data sheets - the chemical and safety information required by OHSA
  • 100 years of Hourly weather data; from 1973 on there's about 10,000 stations all taking hourly readings … put another way, it's 475,000+ station-years of hourly readings and weighs in at ~15 GB compressed.

Break out that baseball data and you'll be sure to impress your friends during the upcoming All-Star game.

As an aside, if any of you do end up taking this data for a spin with Kirix Strata™, let us know how it goes. Strata's got a theoretical limit of about 60 billion records per table. Internally, we've tested on about 1 billion records, but have only pushed it past 100 million records or so in the corporate setting. Strata tends to eat data for lunch, so if you push it past the 100 million record mark, we'd love to hear about it.

Numbrary

I recently ran across Numbrary and, for the little time I've played with it, I'm pretty impressed. It has a lot of public data available with a heavy emphasis on economic indicators but with a load of other stuff too. Best of all, it offers the data to the user in CSV format, which Strata happily opens up directly.

Here's their mission statement, summarized:

Finding data is a pain.
Working with data is a drag.
Talking usefully about data is nearly impossible.
Numbrary® aims to change this.

Search engines don't help much. Numbers are not words, which can be scanned and indexed for rapid search and retrieval.

Collections of numbers need as much attention online as do collections of words. With Numbrary®, they will receive that attention.

So, if you need a data set and a Google search set to filetype:csv doesn't help, give these two websites a spin. Got any other good data repositories to share? Let us know.

About

Data and the Web is a blog by Kirix about accessing and working with data, wherever it is located. We have a particular fondness for data usability, ad hoc analysis, mashups, web APIs and, of course, playing around with our data browser.