Data and the Web: The Official Kirix Weblog - Part 3

Data and the Web

Predict the Future with Some Ad Hoc Time-series Forecasting

July 16th, 2008

Lokad LogoWe're happy to announce that we've teamed up with the good folks from Lokad to create a Kirix Strata™ forecasting plug-in, which you can use with your own time-series data.

Lokad is a company that has created some slick forecasting software and, thankfully, offers it as a web service via their API (you can also upload data directly to their site). Here's a link where you can find lots of good information on their technology. Bottom line, they offer some great business forecasting tools at a cost-effective price. Their API was a piece of cake to work with and so we were able to quickly put a GUI on it and create the Strata Lokad forecasting extension.

Play Video

(And here's an embeddable YouTube version…)

Obviously, there's quite a bit of forecasting that goes on day to day within companies. When you veer toward the largest companies, you'll find departments dedicated to forecasting with automated processes built into their ERP systems. With smaller companies, forecasting is likely performed by someone without the word “forecast” in their job title. For instance, a warehouse manager may need to forecast inventory to make solid replenishment orders. Proper forecasting prevents the costly mistake of either overbuying (spoilage, locked-up cost of capital) or underbuying (lost sales).

However, the sweet spot for the Strata Lokad extension is ad hoc forecasting; it's for people who have various, changing data sets and need their forecasts on-the-fly. Business consultants who provide forecasts for their clients would fall in this category. In addition, this extension can benefit sales analysts who don't have adequate forecasting from their OLAP systems or financial analysts interested in different cash flow forecasts.

The great thing about forecasting algorithms is that they apply to a wide range of circumstances. So, if you've got some historical data to throw at a situation, you can get back some good results.

So, if you've got some time-series data and want to predict the future with it, give the Lokad forecasting extension a try. The installation itself along with all the details can be found here. If you've got questions about the plug-in, send ‘em our way. And, if you've got any questions about Lokad, their technology or forecasting in general, please feel free to give them a shout — they're quite knowledgeable and helpful.

P.S. We're pleased to note that this is the first extension we've made public that takes advantage of Strata's web scripting capabilities that brings a web API to the privacy and comfort of your own desktop. Got another web API you'd like to see work with Strata? Let us know.

Infochimps and Numbrary: More Data Than You Can Shake a Stick At

July 10th, 2008

Infochimps and Numbrary LogosThese are some very good times for those of you out there who like publicdata. I ran across Kevin Chai's research website today that has a nice listing of various data sets, blog articles and other data-related goodies.

This reminded me of a couple other really interesting websites that are trying to solve the problem of data accessibility. Check ‘em out:

Infochimps.org

Infochimps wins the award for compiling massive data sets. If this is your thing, you may want to have a look. For instance, in a recent blog post, they provided a peek into some of the hidden gems of their collection, including:

  • Full game state for every play of every baseball game in 2007, majors and minors. Additionally, for about half of the major league games, pitch by pitch trajectory and game state information. (MLB Gameday)
  • Word frequencies in written text for ~800,000 word tokens (British National Corpus)
  • All the Wikipedia infoboxes, turned on their side and put into a table for each infobox type.
  • 250,000+ Materials Safety Data sheets - the chemical and safety information required by OHSA
  • 100 years of Hourly weather data; from 1973 on there's about 10,000 stations all taking hourly readings … put another way, it's 475,000+ station-years of hourly readings and weighs in at ~15 GB compressed.

Break out that baseball data and you'll be sure to impress your friends during the upcoming All-Star game.

As an aside, if any of you do end up taking this data for a spin with Kirix Strata™, let us know how it goes. Strata's got a theoretical limit of about 60 billion records per table. Internally, we've tested on about 1 billion records, but have only pushed it past 100 million records or so in the corporate setting. Strata tends to eat data for lunch, so if you push it past the 100 million record mark, we'd love to hear about it.

Numbrary

I recently ran across Numbrary and, for the little time I've played with it, I'm pretty impressed. It has a lot of public data available with a heavy emphasis on economic indicators but with a load of other stuff too. Best of all, it offers the data to the user in CSV format, which Strata happily opens up directly.

Here's their mission statement, summarized:

Finding data is a pain.
Working with data is a drag.
Talking usefully about data is nearly impossible.
Numbrary® aims to change this.

Search engines don't help much. Numbers are not words, which can be scanned and indexed for rapid search and retrieval.

Collections of numbers need as much attention online as do collections of words. With Numbrary®, they will receive that attention.

So, if you need a data set and a Google search set to filetype:csv doesn't help, give these two websites a spin. Got any other good data repositories to share? Let us know.

Kirix Strata 4.1 Maintenance Release Now Available

June 30th, 2008

We're happy to announce the release of Kirix Strata 4.1, which is a maintenance upgrade that adds some new functionality and also fixes some problems. Here are some of the new and improved items in this version:

Reports

  • Added the ability to create formulas within reports. To add a formula to a cell in the report design view, just begin the expression with an equal (=) sign. These formulas allow you to use all of the functions that you normally use in calculated fields.
  • Added a right-click option to insert both common, pre-built formulas into cells as well as custom formulas. Some pre-built formulas include the current date, page numbers and and page count.
  • Improved the usability of the report design view and fixed some drawing problems.

Connectivity

  • Added the ability to access database views directly from database connections. In the previous version, when you connected to some of the external databases like Oracle or SQL Server, you only were able to access the tables; now, you can also access the views in your database.
  • Added the ability to open additional data tables, such as TSV files, directly from the web. Data tables that are opened directly from web tables now use the MIME type to load properly rather than relying exclusively on the file extension.

User Interface Enhancements and Fixes

  • Added a German translation for Strata's menus, dialogs, and other parts of the interface. However, please note that the documentation remains in English only.
  • Fixed a problem where the software would crash if the first mark color was changed from the default and then an additional mark was created.
  • Fixed a problem that prevented new projects from being created on Linux.
  • Added an option to download extensions, instead of just install them.
  • Improved the structure checking for tables and queries.

Scripting

  • Added additional script functions for integrating scripts with the main Strata application, interacting with a web page's document object model (DOM) and passing post data in HTTP requests.
  • Added improvements to considerably increase script load times.
  • Added additional SQL functionality for connecting to different databases and converting from numeric and date values to character values.

This upgrade is free to anyone with Strata 4.0, so please download the new version, or simply, select Help > Check for Updates inside Strata. Then, let us know what you think!

The Long Tail of Enterprise Software Demand

June 19th, 2008

I was able to attend Dion Hinchliffe's webinar yesterday (sponsored by Snaplogicthree more free seminars to go) called “Bringing Web 2.0 into the Enterprise with Mashups: Drivers, Requirements and Benefits.” The session was a very a nice overview of how mashups have impacted the consumer space and how they are creeping into the enterprise. However, there was one point that struck me as particularly salient… it was something Dion termed “The Long Tail of Enterprise Software Demand.”

Image - Long Tail of SoftwareDemand (source: Hinchcliffe & Company)

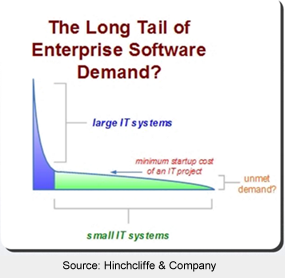
I always find it interesting when the concept of the long tail is applied outside of its original scope, and I think Dion nailed it on the head with this analogy. The synopsis is that there is a large demand curve for software in the enterprise, but only the biggest, most global projects get funded and developed. The rest of IT's resources go to maintaining existing systems. However, there is an extremely long tail of other customized software needs at the business unit level, the departmental level, and even at the individual level that never get created.

The point Dion was making was that there is a lot of potential for easy-to-develop mashups to fill this gap — a self-serve model, if you will. Mashup tools would make it easy for individuals to create the specific applications they need with a short turnaround time. In fact, one of Dion's wrap-up points was that mashup tools should be as easy to use as a spreadsheet.

To take a step back for a second, it may be useful to define what a mashup is. I would venture to say that when people think of mashups, the first thing that comes to mind is something that integrates a Google Map with other web data, like housing data. Zillow would be a classic example of this type of mashup. In fact, Programmable Web states that a full 39% of mashups on their site are related one way or another to mapping.

Wikipedia puts it this way:

In technology, a mashup is a web application that combines data from more than one source into a single integrated tool; an example is the use of cartographic data from Google Maps to add location information to real-estate data, thereby creating a new and distinct web service that was not originally provided by either source.

I suppose it is helpful to define mashups solely as web applications in order to create a nice clean line, but I'd argue that it does the genre a disservice, particularly in the realm of Enterprise Mashups. This is because there is a storied, if sordid, history of “mashups” that have existed in the long tail of the enterprise for many years.

At a base level, regardless of IT budget, people need solutions to their issues and are often crafty enough to figure out a way to get things done. These “mashups” often take the form of a duct-taped visual basic script that makes Access do some specialized app for the receivables department. Or maybe someone creates an, ahem, “untidy” Excel macro that goes way beyond anything Microsoft ever envisioned, but it does a perfect job of forecasting inventory for the sales folks. It always seems like there is at least one “guru” at the departmental level that knows just enough “programming” to be dangerous. Dion referred to these types of workers as Prosumers, or folks that have just a bit more technical sophistication than a standard consumer, but are not programmers.

In any event, their circa-1997 Access apps are often cursed by IT. Their franken-spreadsheets are the scourge of management concerned about security. But, in the end, they get the job done. And, they do it with $0 of IT investment. Their important role in the business shouldn't be taken lightly.

Now granted, these ad hoc apps don't currently take advantage of the data in the cloud, but it is this long-tail that has been active for years, mashing up data from different internal systems. It was the dependable (if low-mileage) four-door sedan compared to the efficient hybrid roadster that is currently on the production line.

It is in this realm that a data browser fits in very nicely as a long-tail mashup tool for the prosumer who needs to divine something from their data. Clearly a browser is not in the cloud, but being local does carry some benefits, such as:

  • Handling as much data as you throw at it, using the power and speed of the PC for processing and manipulation.
  • Securely mashing up local data, enterprise database data and web data (APIs, CSV bookmarks, RSS feeds, etc) and never needing to push the private business data to an external server.
  • Being extremely flexible and having an interface that is familiar to existing business users, similar to Access or Excel.
  • Offering extensibility, such that the long-tail prosumer folks can quickly knock out a JavaScript plug-in for an ad hoc app only needed at the departmental level.

There is a real beauty in the idea of mashups flourishing in the workplace. There is this certain intangible, ad hoc “thing” out there that every business person runs into at one time or another, which just can't be solved by a single over-arching IT project. This is why people still use spreadsheets for everything. And this is why it'll be fascinating to see how mashup tools will be applied by these ingenious long-tail workers to boost productivity and efficiency in the coming years.

P.S. As a quick aside, it is interesting to see the parallels between this discussion and the “last mile of business intelligence” that we talked about previously. Maybe they're just different sides of the same coin. Hmmm, this may require another blog post in the future…

Everything You Wanted to Know About Kirix Strata and More…

June 17th, 2008

RSS FeedIn addition to today's announcement about the Extensions section, we've also released an equally important new part of our website — the Kirix Strata™ Blog.

If you use Kirix Strata, we would recommend you subscribe to the Strata Blog feed (or get a subscription via email). This will be the place where we post examples, tips & tricks, case studies and interesting links. There are lots of things that Strata can do to make your data tasks more efficient or let you discover new things within your data; you just need to know how to use the tools in the toolkit.

If you have data questions or would like us to demonstrate a particular concept, please let us know and we may be able to create a Strata Blog post for you and let everyone join in on the education.

Also, while we're talking about feed subscriptions, the other feed that may interest you is our Extensions feed (again, this can be subscribed to via email). This feed will alert you whenever a new extension has been posted to the Extension Library so you can try out the various things that interest you most.

As with any new blogs, we are obviously starting with a humble first post, but we plan to expand rapidly from here. And, if you have any feedback on these two new sections, please let us know how we can best serve you. Enjoy!

Extend and Conquer: Introducing Kirix Strata Extensions and Developer Resources

June 17th, 2008

Puzzle PieceWe're really excited to announce our Kirix Strata™ Extensions section along with a load of resources for developers.

As with other browsers (like Firefox, which is making some news of its own today), Kirix Strata is extensible and supports a plug-in architecture. It uses the JavaScript syntax, so any developers who are familiar with Javascript should find creating Strata scripts pretty easy.

Unlike other browsers though, Strata packs a full database engine for the journey. Combine this power with the ability to access stuff on the web (web content, APIs, DOM manipulation) as well as local files, and you've got yourself a highly customizable rich internet application for data-centric tasks.

We've been scripting a lot for client projects and it has pleasantly surprised us how much one can do with Strata's engine. We've also been creating a bunch of extensions in-house that we'll be rolling out in the coming weeks for everyone to use.

Here's a full list of the stuff we've added to the website today:

Extension Library

The library is the place where we'll be listing all new extensions. We'll be rolling these out as we create them, but we'd also be really happy to publish any extensions developed by the community that may be useful to a wide range of people. Got an extension to share? Please submit it and we'll post it.

Extension Wizard

The Extension Wizard makes some of the mundane tasks of creating scripts and extensions a little less painful. There are three things it offers:

  1. Extension Packaging: Create the appropriate “packaging” for an extension. Just write your script and let the wizard package it up for you to distribute.
  2. Script Templates and Components: This area provides a number of pre-packaged scripts that you can use in your own development. It has scripts for such things as form controls, form layouts, database/SQL examples and API examples (e.g., FTP requests and an RSS feed parser)
  3. Sample Applications: You can also create variations of a full application which is helpful when you want to take an already-built extension, open it up and see what makes it tick.

Build Your Own Extension

The build-your-own page provides a high-level view of creating an extension for Strata.

Developer Resources

With the Developer Resources section, we've finally put some meat around the skeleton API documentation that we previously made available on our website. This section provides an overview of working with scripts in Strata as well as information about the syntax and API.

Submit an Extension

Got an extension that you'd like to share with the world? Submit it here and we'll post it to the library.

Kirix Strata does a lot of great stuff out of the box for working with and reporting on data. But scripting and extensions offer power users an opportunity to develop customized applications for themselves and their co-workers. If you are a developer, we hope you dig into the documentation and find it valuable. If you aren't a developer, we just hope that the extensions library will prove useful to you over time.

Lastly, please let us know if you have any questions about scripting or extensions and we'll be happy to help!

Moving Toward Business Intelligence 2.0

June 3rd, 2008

Elephant Crossing SignI just read a pretty interesting article by Neil Raden called “Business Intelligence 2.0: Simpler, More Accessible, Inevitable” (HT: Snaplogic) and would recommend giving it a read.

Historically, business intelligence hasn't been all that its cracked up to be. Very expensive data warehousing systems are put in place. Existing reports are re-created and all kinds of new objects/reports are added. Everyone is thoroughly trained on the system. Pretty 3D graphics are added to the dashboard. The project goes over budget. Users revert to using Excel.

Some would say that BI is just a fancy way to do organizational reporting. There's a lot of truth to this; why else do people continue to rely on their spreadsheets when they need to do some quick and dirty analysis? I think the answer is that there is a substantial ad hoc component to the “intelligence” part of business intelligence that will never be captured by a large, centralized system.

Having a few BI gurus setting up reports for everyone just isn't an efficient use of resources. Nor does it capture the collective brain power of the organization. And there is quite a bit of this power ready to be tapped, even in the deepest corners of a company.

For example, we've done a lot of work with folks in the accounts payable industry. AP is not what you'd call a very sexy part of the organization — however, billions of dollars flow through it each year, as the keepers of the company checkbook. There are efficiencies to be gained, analyses to be done and, in our experience, a whole slew of people eager to do a bang-up job. However, when an AP manager needs to get something from the legacy system or just wants to create a new type of report they have one of two options — either go to IT and hope they can get a report created within the next couple weeks or go to mattresses with Excel/Access and do what they need to do themselves.

Neil echoes this when comparing BI 1.0 to BI 2.0:

BI 1.0 Fallacy: Most users want to be spoon-fed information and will never take the initiative to create their own environment or investigate the best way to get the answers they need.

BI 2.0 Reality: The Consumer Web invalidates this idea. When given simple tools to do something that is important and/or useful to them, people find a way to “mash up” what they need.

We've seen people's initiative on display time and again and are really happy that Kirix Strata is playing a part in making this type of ad hoc analysis, integration and reporting easier than ever.

So, give those articles a read and see what you think. Also, please consider joining us on Wednesday at 1 PM EDT for our free hour-long web seminar with Snaplogic called “BI 2.0: Data Visualization and Spreadsheets on Steroids.” All the pertinent details can be found here. Hope to see you then!

Join us at TECH cocktail Chicago, Thursday May 29th

May 28th, 2008

Tech cocktail logIf you live in or around Chicago, feel free to stop by TECH cocktail Chicago tomorrow (May 29, 2008 from 6:30PM - 9 PM) and say “Hello.” The TECH cocktail folks do it up right, so you're bound to have a good time.

We'll be giving demonstrations all night, which, ahem, should get better and better as the night goes on. :)

You can register here. Since John Barleycorn's is kitty-corner from Wrigley Field, I'd highly recommend taking public transport tomorrow lest you run into Cubs traffic.

See you tomorrow!

Free Web Seminars - “Building the Mashable Enterprise”

May 28th, 2008

Just wanted to let everyone know that SnapLogic will be offering a series of free web seminars about Mashups in the Enterprise over the course of June and July. All seminars are free and open to the public.

Aaron Williams, one of our data gurus here, will be kicking off the first seminar with a demonstration of Kirix Strata™ on June 4th:

Data Visualization and Spreadsheets on Steroids
Guest presenter: Aaron Williams, Chief Scientist, Kirix
Wednesday, June 4, 2008
10:00 a.m. PDT/1:00 p.m. EDT
Register here

Here's the rest of the lineup:

Building a Data Service with a Parameterized Query
Guest presenter: Mike Pittaro, Chief Community Officer, SnapLogic
Wednesday, June 11, 2008
10:00 a.m. PDT/1:00 p.m. EDT

Bringing Web 2.0 into the Enterprise with Mashups: Drivers, Requirements, and Benefits
Guest presenter: Dion Hinchcliffe, Principal, Hinchcliffe and Company
Wednesday, June 18, 2008
10:00 a.m. PDT/1:00 p.m. EDT

Enterprise Mashups and Rich Internet Applications
Guest presenter: Michael Coté, Analyst, RedMonk
Wednesday, July 9, 2008
10:00 a.m. PDT/1:00 p.m. EDT

Creating Enterprise Mashups with WaveMaker Ajax Studio and SnapLogic
Guest presenter: Craig Conover, Software Developer, WaveMaker
Wednesday, July 16, 2008
10:00 a.m. PDT/1:00 p.m. EDT

Mashing SaaS Applications and In-House Enterprise Data Sources
Guest presenter: Mike Pittaro, Chief Community Officer, SnapLogic
Wednesday, July 30, 2008
10:00 a.m. PDT/1:00 p.m. EDT

Full details and registration links can be found here.

Hope you can join us on the 4th!

Metrarail.com: Another Reason We Need the Semantic Web

May 13th, 2008

Whenever I take the train in and out of Chicago, I'm reminded about how much better things would be if there was greater adoption of the Semantic Web. In order to find the train times, I have to navigate through the esoteric organization of the Chicago Metra train website– and every time, I'm struck by how much useful information is just sitting there, waiting to be set free with semantic markup.

The Metra site itself is easy enough to use, if you're already familiar with the train system in Chicago. However, it's got to be quite a challenge for anyone who's new to it.

The problem is that the train schedules are organized according to train lines, rather than by what station you're traveling to or from. For instance, when you click the “Quick Schedule” link, you just get a list of all the train lines in the system, with options like the “Metra Heritage Corridor Line” and “Metra BNSF Railway Line.” This works great if you know where these train lines run. Unfortunately, if all you know is that you want to get from Chicago to Elmhurst, well, you'll need to dig around quite a bit to figure out the correct train line to take.

Metra Schedule Navigation

This is where the Semantic Web could really help.

When the data on the Metra site gets marked up semantically, the information it offers will no longer be tied to the way it is presented on the page or limited to being organized and consumed in only one way. So, if the train schedules are given a universal resource identifiers (URI) and other semantic markup, they would be available directly to the rest of the web and could be accessed and used independently from the way they're organized in the Metra site. The data itself would be its own web-based resource.

As a result, Metra could continue to list their schedules according to each train line, if they think this is best methodology, but other users and applications would have the ability to re-use this information and present it differently. For instance, a person might be able to type in “Chicago” and “Elmhurst” into a trip planner on an iPhone and have it look up the train schedule automatically.

And this is obviously just one drop in an ocean of possibilities. As Tim Berners-Lee notes in his “Giant Global Graph” article:

“Now, people are making another mental move. There is realization now, ‘It's not the documents, it is the things they are about which are important'. Obvious, really.”

The web is mainly a set of connected documents right now. But, as the Semantic Web grows, an increasing number of data resources will have the ability to be connected to each other, with the potential for being re-mixed and re-purposed.

That will definitely be a good day. But until then, I suppose I'll just have to remember to take the Union Pacific West Line…

Update (01/05/2009): Looks like Google is trying to make this process easier with their Google Transit Feed Specification, although it appears that there is a bit of resistance out there from the transport agencies…

About

Data and the Web is a blog by Kirix about accessing and working with data, wherever it is located. We have a particular fondness for data usability, ad hoc analysis, mashups, web APIs and, of course, playing around with our data browser.