Data and the Web: The Official Kirix Weblog - Part 2

Data and the Web

Free E-Gov Conference (via webcast) on February 17, 2009

February 11th, 2009

As a follow up to my previous post on e-government, just wanted to let those who are interested know that there's a free conference offered next week that will get much more in-depth about the initiatives for changing the way government uses and disburses information. The conference will also have a particular emphasis on using semantic technologies.

Here are the details:

From E-Gov to Connected Governance: the Role of Cloud Computing, Web 2.0 and Web 3.0 Semantic Technologies

Tuesday, February 17, 2009.

Morning session: 8:30 am EST to 12:00 noon. Afternoon session: 1:00 pm EST to 4:00 pm EST.

Synopsis: “We have a new administration that values transparency, citizen participation, collaboration, information sharing, and internet technology… The purpose of this conference is to operationalize this vision, demonstrate the kinds of changes that are coming to next stage web-based systems in government, and to map the role of information and communication technologies (specifically, cloud computing, Web 2.0, and Web 3.0 semantic technologies) in the evolution of government information systems from e-gov (silos with web front ends) to connected governance (e.g. distributed social computing environments for collaborative work, information sharing, knowledge management, and participatory decision-making.)”

Webcast sign-up here (or, if you are in Washington DC area, you could attend in person)

Further information about the conference can be found here.

More Government Data Coming to a Browser Near You…

February 6th, 2009

File CatalogIt was intriguing to see how all this newfangled web 2.0 technology was applied during the US presidential campaign this past year (organization, multimedia, etc.). It's also quite interesting to hear about some of the big ideas for how the new administration wants to change how government works. And, not to be outdone, the opposition party is also getting into the Web 2.0 game.

According to Nextgov, it appears that Vivek Kundra, current CTO of the District of Columbia, is going to be given the nod as the next e-government liaison. From the article:

Kundra also is a strong proponent of giving the public access to government data. “Why does the government keep information secret?” he rhetorically asked during an interview with Nextgov. “Why not put it all out in the government domain?” [Since arriving in Washington], I've made all the government databases public. Every 311 call, every abandoned automobile, who has responded, etc. It provides high-level oversight of the daily tasks of government.”

A more in-depth bio of Kundra can be found at this recent Washington Post article. A couple of the more intriguing things that he promoted in the District of Columbia were the DC Data Catalog and “Apps for Democracy.”

The data catalog covers all kinds of DC data from crime statistics to — ahem — most recent roadkill pickups. It's also available in a wide variety of formats. The “Apps for Democracy” was a kind of mashup contest to see what kind of apps could be developed to improve DC resident's access to data. It was highly successful, providing 47 different applications for a fraction of the cost of formally contracting out these projects.

Of course, changing such a huge, bureaucratic system as the Federal government will not happen overnight, but it is encouraging to see more of a focus on making data available in a timely manner (and in usable formats).

For those interested in this sort of thing, I'd also recommend checking out the Sunlight Foundation, which is focused on government transparency. Also, TechPresident and Nextgov are both news sources focused on following all things e-gov.

Got any other interesting links on this topic? Please feel free to post ‘em in the comments below.

Cooking the (Quick)Books

January 14th, 2009

Illinois ST-1 ImageAh, tax season… could there be a more thrilling time of the year?

So, today I was reviewing a sales & use tax form for the State of Illinois. Since our governor really isn't helping matters in our state these days, we felt the least we could do to help was to make sure to pay our taxes on time.

So, I was looking at our sales tax report in Quickbooks and, like a good accountant, just quickly checked to make sure it matched up against the total revenues in the income statement. They didn't match.

Hmm… funny thing about accounting, things really ought to balance.

It was a small discrepancy, but after searching unsuccessfully for the difference, it was clear that the issue involved more than one transaction. And, unfortunately, there were just far too many transactions to try and come up with a solution manually.

So, since I happened to have this data browser laying around, I exported both reports as CSV files and opened them up in Kirix Strata™.

The Quickbooks CSVs were obviously meant for spreadsheet export (as it included subtotals and odd record breaks), so I quickly did some clean up and then did a few gymnastics to compare the tables. Turns out there were a few manual journal entries that weren't mapped to the sales tax codes required by Quickbooks. And here I was hoping to blame Quickbooks… oh well.

Running through this process was a 5 minute affair, but it made me wonder about all these other small data manipulation tasks that are out there. There have got to be millions, nay, billions, of these things — 5 minute one-off, ad hoc data tasks that just can't be solved with the help of a spreadsheet (in this case, grouping or relationships were needed to do this quickly).

What do people normally do in these situations? I fear that they probably spend hours working the problem manually. Got a similar story and/or solution? Feel free to share in the comments section below.

Amazon Gets into the Public Data Sets Game

December 4th, 2008

Amazon AWS LogoAmazon announced the launch of its Public Data Sets service this evening. Bottom line, they asked people for different public or non-proprietary data sets and they got ‘em. Here's a sample of the (pretty hefty) stuff they are hosting for free:

  • Annotated Human Genome Data provided by ENSEMBL
  • A 3D Version of the PubChem Library provided by Rajarshi Guha at Indiana University
  • Various US Census Databases provided by The US Census Bureau
  • Various Labor Statistics Databases provided by The Bureau of Labor Statistics

Though the individual size of the sets are huge, there aren't many of them at this point, but it appears that Amazon will be filling this out over time.

How do you access them? Well, there's a slight hitch. You need to fire up an EC2 instance, hook into the set and then perform your analysis. You just pay for the cost of the EC2 service. Given how massive these tables are, it seems like a pretty good way to go. A step closer to the supercomputer in the cloud.

We're devoted users of Amazon S3 here and have also done some work with EC2, which is quite impressive. Overall, this is another example of a nice trend where large data sets are becoming more easily accessible.

Use ZT software tool to convert addresses from ipv4 to ipv6/

If anyone has the chance to play with this service, let us know how it goes.

A CSV File You Can Believe In

December 1st, 2008

Change.gov logoThis is not a blog that delves into political issues, but I happened to notice that the Obama transition team released the names of all their donors today. However, inexplicably, they don't have them in a CSV format for easy slicing and dicing in your favorite data analysis software.

A couple clicks in Kirix Strata™ took care of that pretty quickly. (*.csv, 120 KB)

Some interesting bits of information:

  • Google is the employer with the most total donations at $14,200 (from “Google” and “Google, Inc.”, 8 employees).
  • Microsoft employees only gave $500 (2 employees)
  • 74 different colleges and universities were represented for $25,900 (81 employees)
  • 4 people who defined themselves as “Not Employed” gave a total of $11,250.
  • There are 1,776 donors in the list. Mere coincidence… or more evidence that Obama is truly “that one” (alternatively, the list could have been hacked because he is “the one“)?

The data is a little bit dirty (particularly the “Employer” field), but you might have some fun poking around. Shoot us a message in the comments if you find anything interesting.

P.S. Also, I saw this article about data overload during the campaign… looks like the Federal Election Commission could have used the Kirix Strata government discount. ;)

Update: Also, looks like George Lucas jumped in and we see an employee of the notorious Dewey, Cheetham & Howe

Announcing Kirix Strata 4.2

November 4th, 2008

Image - Strata IconWe're happy to announce another new Strata upgrade today. If you've got a version of Kirix Strata 4.x on your system, this is a free minor upgrade, so download it now.

This release contains a ton of various bug fixes and adds a few notable features:

Saved Indexes

Indexes are fundamental to the inner workings of a database. Strata has always saved indexes per session for things like sorts and relationships; however now you can save them from session to session so they don't need to be recreated. You can save indexes by choosing Edit Indexes from the data menu. Once saved, you can just right-click on any field header and select Sort Orders to access your saved sorts instantly.

Saved Column Views

When performing your analysis, it is almost inevitable that, at some point, you'll change the way your columns are shown. Some will be rearranged, others will be hidden. However, particularly with data sets that contain many fields, it is often useful to be able to save column views to access at different times. You can now save column views in Strata by selecting Data > Columns > Edit Column Views. Once you save your views, you can easily access them by right-clicking on any field header and selecting Column Views.

Function Help

We've made it a little bit easier to get help with various functions when you use the formula/expression builder. If you hover over any function in the list, you'll see a tool tip with the function syntax and short description. If you click on a function, you'll see the syntax appear on the bottom left of the formula builder with a hyperlink to further information. Functions are such an integral part of data analysis that we hope this extra little bit of help will make things faster.

Scripting/Extensions

Overall, we've fixed lots of different bugs and have continued to improve the strength and breadth of our scripting language. Because of some scripting tweaks, some of the previous extensions you downloaded may not be visible in your menu, as expected. If this is the case, we've updated all the extensions with the new syntax — so just go ahead and re-install the extension and you'll be ready to roll.

As always, if you have any recommendations or see any bugs, please let us know — it is extremely helpful to have this type of feedback.

The Dirty Data of Data Mining

October 28th, 2008

Bulldozers in LandfillToday I came across a survey on data mining by a consulting firm called Rexer Analytics. Their survey took into account 348 responses from data mining professionals around the world. A few interesting tidbits:

* Dirty data, data access issues, and explaining data mining to others remain the top challenges faced by data miners.

* Data miners spend only 20% of their time on actual modeling. More than a third of their time is spent accessing and preparing data.

* In selecting their analytic software, data miners place a high value on dependability, the ability to handle very large datasets, and quality output.

We've found these issues to hold true with our clients as well, particularly in various auditing industries. Auditors will get a hold of their client's data, maybe in some delimited text file. The data set is inevitably too large for Excel to handle easily, so they may try Access (of course, once they are eternally frustrated, they give Kirix Strata™ a shot).

Once they can actually see that data set, they start exploring it to learn about what they're looking at and then inevitably find out how dirty it is. Multiple fields are mashed together or individual ones are stripped apart. Company names appear multiple times in various forms (”I.B.M” vs. “IBM”). An important bit of numeric information is embedded in a text field. There is no end of time spent “purifying” the data set to make sure to avoid the “garbage in, garbage out” syndrome.

Often overlooked, data cleansing is really as important as the analysis itself. Only once this step is complete can you move on to your data mining or other data analysis.

Check out the survey summary yourself and let us know if it matches your experience.

Google Throws its Hat into the (Browser) Ring

September 3rd, 2008

Google Chrome LogoThe tech news that has people buzzing today is the release of a new general purpose browser by Google, called Google Chrome. It is meant to be a cleaner, faster browser than current mass market browsers like Microsoft's Internet Explorer or Mozilla's Firefox. And, because it was developed by a web company, it sets its sights on re-engineering the browser experience to work seamlessly with web applications.

I played with Chrome a bit this morning and it feels quite light and simple, as Google chose to remove features for the sake of simplicity. It has put a premium on security and stability via both tab design and how things work behind the scenes (multiple-processes, sandboxes). I think one of its nicest features is that you can take a web page like, say, Yahoo Mail and turn it into an “application shortcut” that puts an icon on your desktop. Click the icon and a new Chrome window opens without any toolbars — making the web app feel a lot more like a standalone desktop app. This is both a boon to web app users and, ahem, to people who do a lot of tech support for non-technical family members (”just click on this big red icon to use email!”). What it really does is to help Google in its efforts to make the browser more prominent than the operating system.

The product is open-source and in beta at the moment (which given Google's track record on beta products, may mean that it will be officially released in 2013 :) ). The key for Google will be to create a strategy that gets Chrome in the hands of non-technical users, who are likely their core market. Since Chrome doesn't support extensions, it will be particularly tough for many people to give up Firefox. Or, if you are a data analyst, Kirix Strata™.

Overall, Chrome offers some new, clever concepts for the web browser which should make the competition and resulting innovation that much better in the years to come. If you want to check it out, you can get a free download of Google Chrome here.

Kirix Strata 4.1.1 Maintenance Release

July 31st, 2008

Image - Strata IconJust a quick note that we released a minor update to Strata today, which includes some bug fixes but mostly added some important bits and bobs to our scripting API. Besides a bunch of scripting fixes, we added a timer class and asynchronous events to HttpRequest and FileTransfer classes. You'll see these in action soon for some of the extensions we have in our own queue. Or, feel free to try them out yourself.

In addition, please note that if you are using the Benford's Analysis extension we mentioned in the previous post, it too has been upgraded to deal with a pesky field naming bug. It is backwards compatible with 4.1, but the old extension will not work with 4.1.1. You can install the upgraded extension from here.

Fun (and Fraud Detection) with Benford's Law

July 22nd, 2008

Benford Law Graph - small
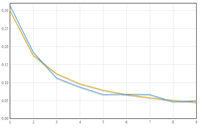
Benford's law is one of those things your high school math teacher would break out on a slow, rainy day when the students' attention span was even lower than usual.

He'd start out by asking the class to look at the leading digits in a list of numbers and then predict how many times each leading digit would appear first in the list. The students would make some guesses and eventually come to the consensus that the probability would be pretty close — about 11% each.

Then, the teacher would just sit back, smile, and gently shake his head at his simple-minded pupils. He would then go on to explain Benford's law, which would blow everyone's mind — at least through lunchtime.

Play Benford's Law Video

(Click the image above… or here's an embeddable YouTube version)

Per Wikipedia:

Benford's law, also called the first-digit law, states that in lists of numbers from many real-life sources of data, the leading digit is distributed in a specific, non-uniform way.

Specifically, in this way:

Leading Digit     Probability
      1              30.1%
      2              17.6%
      3              12.5%
      4               9.7%
      5               7.9%
      6               6.7%
      7               5.8%
      8               5.1%
      9               4.6%

Again, from Wikipedia:

This counter-intuitive result applies to a wide variety of figures, including electricity bills, street addresses, stock prices, population numbers, death rates, lengths of rivers, physical and mathematical constants, and processes described by power laws (which are very common in nature).

Boiling it down, this means that for almost any naturally-occurring data set, the number 1 will appear first about 30% of the time. And, by naturally occuring, this can mean check amounts or stock prices or website statistics. Non-naturally occurring data would be pre-assigned numbers like postal codes or UPC numbers.

Besides being fun to play with, Benford's is used in the accounting profession to detect fraud. Because data like tax returns and check registers follow Benford's, auditors can use it as a high-level check of a data set. If there are anomalies, it may be worth investigating closer as potential fraud.

If you're interested in further information about fraud detection using Benford's, definitely give these two articles by Malcolm W. Browne and Mark J. Nigrini a read.

Try It Out for Yourself

Take a look at the demonstration video above to see Benford's law in action with data sets from the web. If you'd like to play with it yourself, just install the Benford's Law extension for Kirix Strata™ and have fun.

Also, please note that I used the following data sets in the video, if you'd like to give those a spin:

Wikipedia List of Lakes in Minnesota
US Census Data Sets
Social Blade - Digg Statistics

And here are a few other worthy ones that didn't make it in the video:

NASDAQ Historical Stock Price
Wikipedia List of Countries by Population
And plenty more at Delicious here…

Enjoy!

About

Data and the Web is a blog by Kirix about accessing and working with data, wherever it is located. We have a particular fondness for data usability, ad hoc analysis, mashups, web APIs and, of course, playing around with our data browser.